How Bullying, Disordered Eating, and Depression Symptoms are Related

What's the science?

Adolescent bullying is a serious issue affecting approximately 30% of adolescents, and can have negative effects on mental health. In particular, bullying is associated with eating disorders and depression, but the longitudinal relationship between bullying, disordered eating and depression is not well understood. This week in JAMA Psychiatry, Lee and Vaillancourt tested the longitudinal relationship between these factors, in order to determine targets for intervention.

How did they do it?

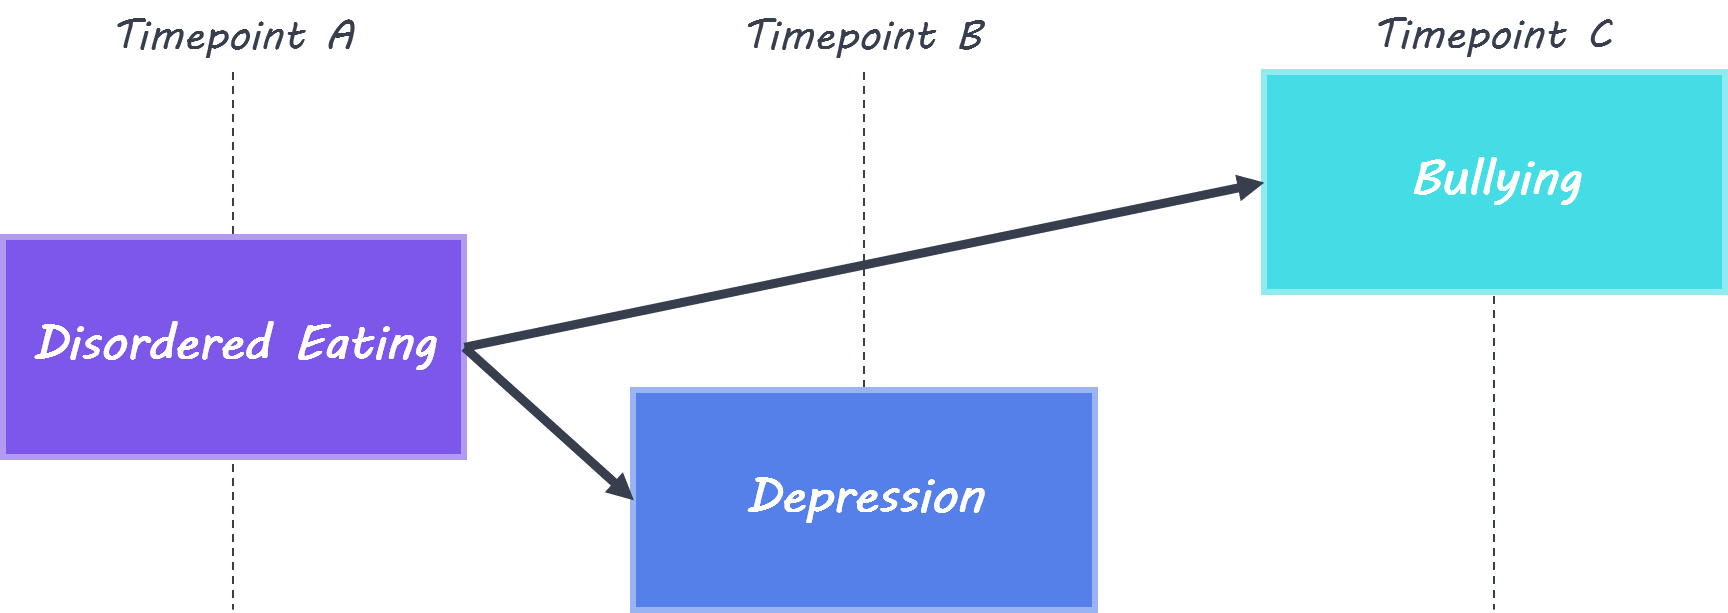
The authors recruited adolescents aged 13-17, who were part of the McMaster Teen Study (a Canadian longitudinal study). 612 students completed questionnaires at several timepoints between ages 13 and 17 (a 5 year period). Students reported the frequency and type of bullying, to comprise a bullying severity score. The Short Screen for Eating Disorders questionnaire was used to measure the severity of disordered eating behaviour, and the Behaviour Assessment System for Children 2 was used to measure depression. The authors built several statistical models using these three variables plus control variables (sex, family income, race) to examine the relationships between these three factors, and assessed how well these models fit the data. In one model, ‘cross-lag’, meaning the effect of one factor at one timepoint on a different factor at a later timepoint, was modeled using a cascade modeling approach.

What did they find?

At each timepoint, there were significant positive relationships between the severity of bullying, disordered eating, and depressive symptoms. Girls reported more severe bullying, disordered eating, and depressive symptoms than boys. In the model which included ‘cross-lag’ effects, disordered eating was linked to depression one year later (at all timepoints) and to bullying two years later (at two timepoints). When sex differences were included in the model, it was discovered that there was a stronger relationship between disordered eating and depression in girls at most timepoints, while depression was more stable over time in boys.

Relationship between disordered eating, depression and bullying

What's the impact?

This is the first study to assess the relationship between bullying, disordered eating and depression in adolescents longitudinally. The results indicate that disordered eating at an earlier timepoint can predict both depression and bullying at later timepoints. This could be due to shared genetic factors underlying disordered eating, depression and bullying, or emotional dysregulation which is tied to disordered eating and could be a risk factor for bullying. This study suggests that targeting disordered eating and associated symptoms could reduce future depression and bullying in adolescents.

bully.png

K.S. Lee and T. Vaillancourt, Longitudinal Associations Among Bullying by Peers, Disordered Eating Behavior, and Symptoms of Depression During Adolescence. JAMA Psychiatry (2018). Access the original scientific publication here.

Microglial Cell Memory Can Change Neuropathology

What's the science?

Microglia are the resident macrophages of the brain’s innate immune system and respond to injury or pathogens. Some innate immune cells in the body have a memory; they may exhibit a ‘training response’, meaning they show an increased inflammatory response to a pathogen the second time it is presented. They may also develop another type of memory called ‘tolerance’ where inflammation is reduced after a pathogen is presented numerous times. We don’t know whether immune training or tolerance exist in microglia or whether these features play a role in shaping neurological diseases later in life. This week in Nature, Wendeln and colleagues explored whether microglial-mediated immune responses in the brain depend on the history of immune responses, indicating immune memory.

How did they do it?

First, they tested whether immune activation in the body (periphery) induced immune memory or tolerance in the brain. Control mice and microglia knockout mice were given lipopolysaccharides (LPS), an inflammatory molecule that induces sickness behavior and peripheral inflammation, up to four times, and the immune response was observed after each administration. Next, to test whether immune memory or tolerance affects neuropathology, they used two models: First, they used APP23 mice, in which amyloid-β plaques are produced (Alzheimer’s disease pathology model). Second, they used an ischemia model (inducing brain ischemia as a model for stroke). They tested whether peripheral LPS stimulation induced immune memory in the brain and modulated later occurring neuropathologies. Finally, they isolated microglia from mice at 9 months of age who had been treated with one or four LPS administrations 6 months prior, and looked at markers for enhancers (regulatory elements of DNA that enhance expression of certain genes) to understand whether epigenetic factors underlie the microglia responses.

What did they find?

When LPS was administered to control mice, more cytokines (normally released as part of an inflammatory response) were released in the brain after the second administration compared to the first, indicating that ‘immune training’ in the brain does occur. This response was not seen in microglia knockout mice, demonstrating that microglia play a key role in immune training. In contrast, cytokine release in the brain diminished after four LPS injections (i.e. a larger number of exposures to peripheral inflammation), indicating ‘immune tolerance’ in the brain. In the next experiment, APP23 mice (Alzheimer’s pathology model) were examined 6 months after LPS treatment (applied before brain pathology developed). Here, brain plaques were increased in mice who had been administered LPS once (suggesting immune training could increase plaque occurrence), and decreased in mice who had been treated with four LPS injections (suggesting immune tolerance could reduce plaques). Treatment with LPS also altered the brain’s immune response to plaque deposition, as shown by changes in certain cytokine levels. In the ischemia (stroke) model, mice administered LPS once showed increased levels of cytokines in the brain, while mice administered LPS four times, showed decreased levels, demonstrating immune training and tolerance respectively. Brain damage following ischemia was reduced only in mice administered LPS four times, indicating that immune ‘tolerance’ may be protective against future neuropathology. In isolated microglia, markers for enhancers were increased in different signaling pathways after one LPS administration (immune ‘training’ response) versus after four administrations (immune ‘tolerance’ response), indicating that epigenetic changes in microglia following peripheral immune stimulation underlie these long-term effects.

Alzheimer’s and amyloid-beta plaques

What's the impact?

This is the first study to characterize the ‘memory’ of the innate immune response of microglia in the brain and its role in modifying neuropathologies. The results suggest that certain neuropathologies (such as Alzheimer’s or stroke) may be altered by microglial immune memory due to much earlier occurring immune stimulation in the periphery. Next, it will be important to understand precisely which immune stimuli change the microglial response and in what way.

A. Wendeln et al., Innate immune memory in the brain shapes neurological disease hallmarks. Nature (2018). Access the original scientific publication here.

Connectivity of the Amygdala Predicts Risk Tolerance

What's the science?

Risk can be thought of as uncertainty — when there is some information about the possible outcome of a situation. Different individuals have different tolerance for risk when making decisions. We know that certain brain regions are generally involved in risk perception from studies looking at brain activation during risk (e.g. medial prefrontal cortex, anterior insula, anterior cingulate cortex, amygdala), however, we don’t know which brain regions and which inherent properties of these brain regions affect individual risk tolerance. This week in Neuron, Jung and colleagues use a data-driven approach to determine which brain regions and functional properties of these regions predict individual risk tolerance.

How did they do it?

Anatomical MRI, resting-state MRI (brain activity at rest) and Diffusion Tensor Imaging (structural connectivity) data from 108 healthy adults were acquired. Participants also performed a well-validated risk task to assess their risk tolerance. This task involves making binary decisions over several trials, choosing between a certain monetary reward and a larger uncertain (i.e. riskier) reward. They first analyzed the resting-state MRI data to compute individual functional connectivity throughout the brain (synchrony between brain regions at rest) to determine important regions that show a large amount of synchrony with other brain regions (i.e. highly central brain regions). In an exploratory, data-driven approach, they then assessed whether the strength of the functional connectivity in any these regions throughout the brain predicted individual risk tolerance.

What did they find?

The strength of functional connectivity in the amygdala showed the strongest correlation with risk tolerance of any brain region. Based on this finding, the authors focused on the amygdala for the remainder of their analyses. They tested which specific functional connections of the amygdala were important for risk tolerance. They used the amygdala as a seed region and found that the medial prefrontal cortex showed the strongest functional connections. There was a positive correlation between risk tolerance and functional connectivity between the amygdala and the medial prefrontal cortex; greater risk tolerance was associated with stronger functional connections. They then assessed whether the structural connectivity (white matter tracts) between the amygdala and the medial prefrontal cortex was associated with risk tolerance, and found that there was a negative correlation between structural connectivity and risk tolerance;  stronger white matter tract connectivity was associated with lower risk tolerance (significant for the right amygdala, and trending for the left amygdala). They also found that more gray matter volume in the amygdala was associated with a higher risk tolerance. In a regression analysis, they found that functional connectivity, gray matter volume and tract strength (only on the right) were all predictors of individual risk tolerance.

Amygdala functional connectivity and risk tolerance

What's the impact?

This is the first study to show that the inherent properties of the amygdala and its’ connections are associated with individual risk tolerance. This study suggests that an individual’s brain structure and function, which can be thought of as their “brain signature” can be used to predict individual behavior. Localizing brain regions involved in risk tolerance is important for understanding why some individuals engage in risk-taking behavior.

kable.png

W.H. Jung et al., Amygdala Functional and Structural Connectivity Predicts Individual Risk Tolerance. Neuron (2018). Access the original scientific publication here.