Driving Brain Plasticity with Gamma Oscillations

Post by Anastasia Sares

What's the science?

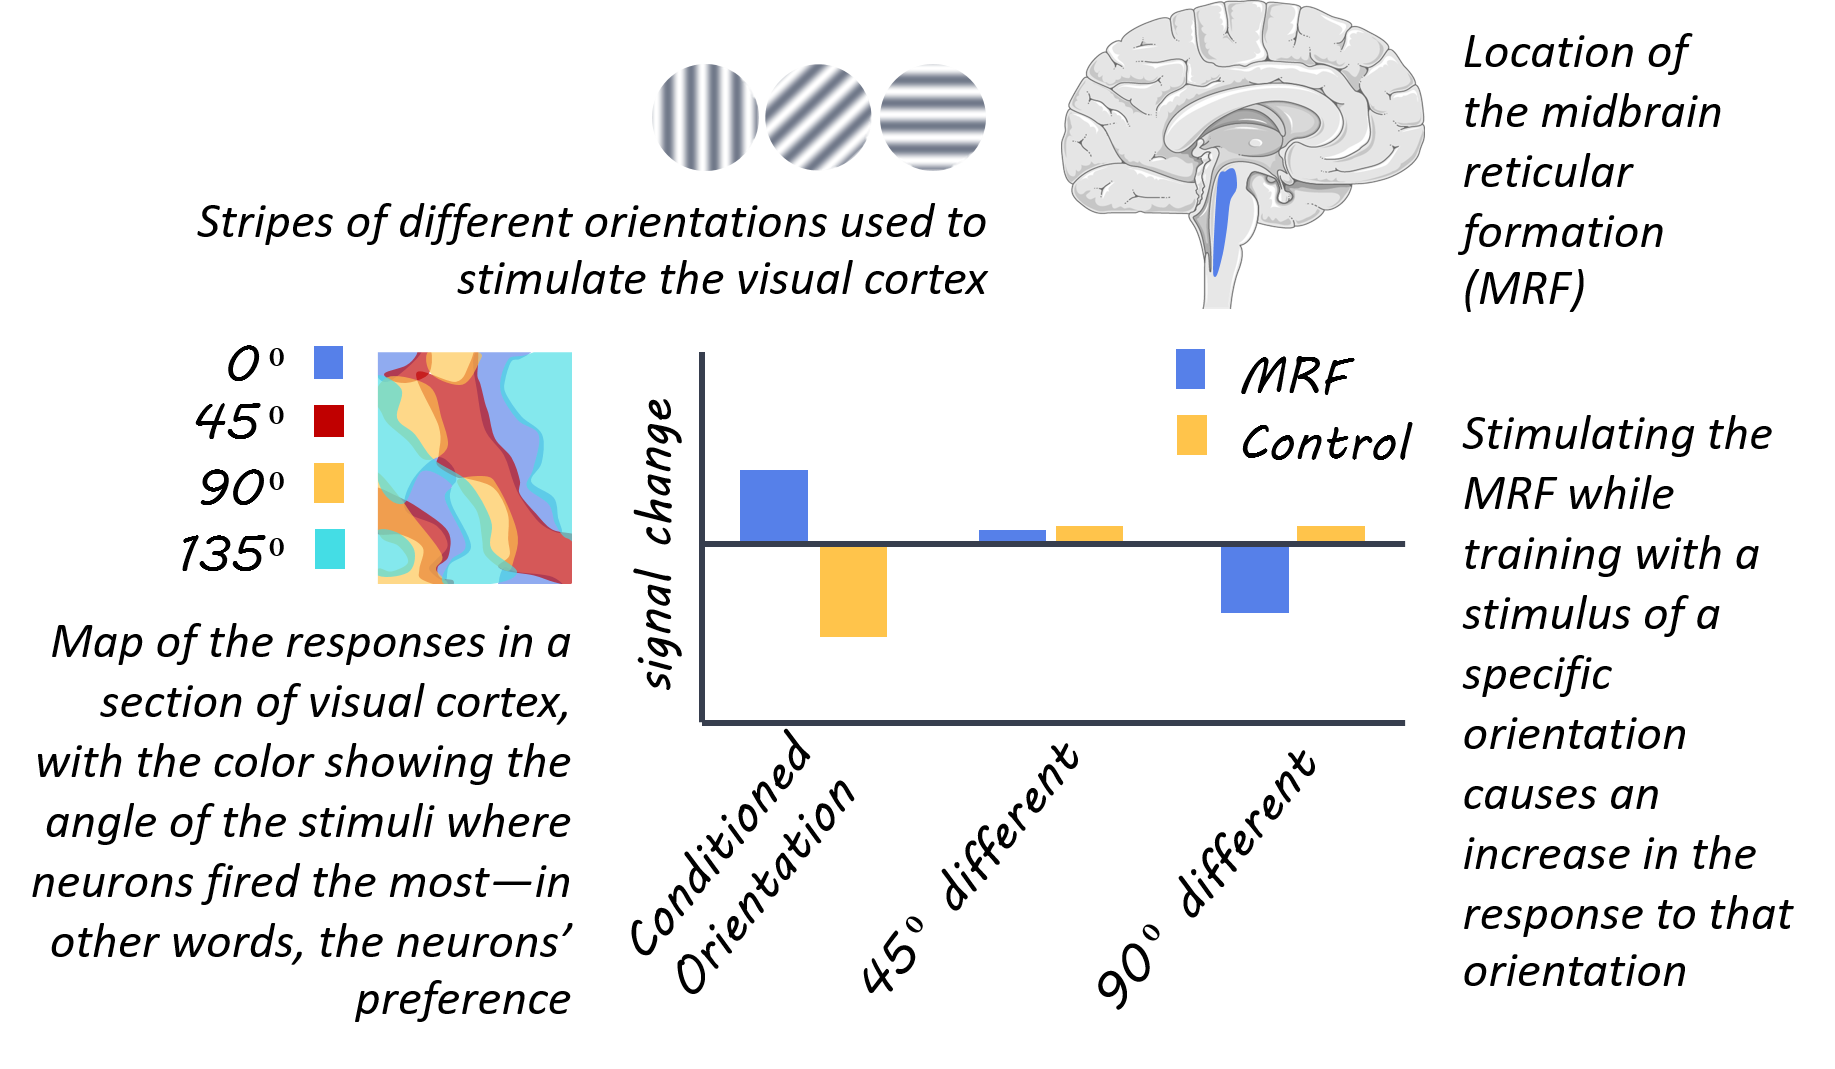
The visual cortex is a classical area for studying neuron tuning, specialization, and brain plasticity. Located in the very back of the brain, the visual cortex was studied as early as the 1960s, and it was discovered that different clusters of neurons responded to moving stripes oriented at different angles. Changing the preferred orientation of some neurons is a small-scale example of brain plasticity, but it doesn’t happen all by itself. Something has to happen in the brain to change the status quo. This week in Proceedings of the National Academy of Sciences, Galuske and colleagues induced brain plasticity by pairing visual conditioning with stimulation of a brainstem area (midbrain reticular formation).

How did they do it?

The authors studied the visual cortex of cats, implanting electrodes in order to record neural activity (more specifically: electrocorticograms, multiunit activity, and local field potentials), and also performed optical imaging. They recorded neural responses to different orientations of stripes to create an “orientation map” of the cortex. Recordings took place before and after a long conditioning session, where the cats were exposed to moving stripes (also called ‘gratings’) in a single orientation. Repeatedly exposing neurons to the same stimulus (stripes at a certain orientation) usually just causes them to habituate, firing less as they get used to the stimulus. It does not typically change their preferred orientation. However, during some of the conditioning sessions, the authors additionally stimulated the midbrain reticular formation (MRF) in the brainstem. Activity in this brainstem area can enhance gamma oscillations in the visual cortex, which the authors believed would drive plasticity. This plasticity would cause greater responsiveness and attunement to the orientation presented in the conditioning session.

What did they find?

The authors succeeded in causing a plastic change in the visual neurons. After the conditioning session with the MRF being stimulated, more neurons responded to the grating that had been presented. The cells that changed the most were the ones that had originally responded to orientations 10-30 degrees away. These cells were “re-tuned” so that they preferred the orientation presented in the session. The effect lasted at least 6 hours, at which point the researchers stopped measuring it. It wasn’t just stimulation of the MRF that caused this plasticity. Only when MRF stimulation led to an increase in gamma oscillations did this effect show up.

visual_cortex.png

What's the impact?

This study shows that gamma oscillations put the brain’s cortex in a unique state that facilitates plasticity, changing how it represents the outside world. More research is needed to connect gamma oscillations to learning, but some evidence suggests that they may be related to context and prediction, providing a way for the brain to turn plasticity on or off when the need arises.

Galuske et al. Relation between gamma oscillations and neuronal plasticity in the visual cortex. Proceedings of the National Academy of Sciences (2019). Access the original scientific publication here.

The Role of the Brain’s Reward System in Expectation of Pain

Post by Kasey Hemington

What's the science?

Pain is a subjective experience that can be modulated by many factors, including its anticipation. The brain’s reward system works by detecting the difference between events that we experience and their prior anticipation and is known to be involved in how we perceive pain. The ventral tegmental area (VTA) projects to the rostral anterior cingulate cortex and nucleus accumbens via the mesocorticolimbic pathways and is a key part of the brain’s reward system. How these pathways might play a role in encoding our expectations of pain is not clear. This week in The Journal of Neuroscience, Tu and colleagues studied the structure and function of the mesocorticolimbic pathways using magnetic resonance imaging (MRI) during a task in which humans anticipated a painful experience.

How did they do it?

Twenty-nine young adults (14 females) participated in the experiment, which involved a calibration phase, a conditioning phase, and a test phase. During the calibration phase, electrical stimulation was delivered to the forearm to identify the level at which each individual reported low pain (2/10), moderate pain (4/10) and high pain (6/10). In the conditioning phase, participants saw a + sign or – sign on a screen, which they were told was ‘associated with a painful stimulus’. Fifteen seconds after seeing the + sign or – sign, the high pain or low pain level of electrical stimulation respectively was delivered. In other words, the participants were conditioned to associate the + with more pain and the – with less pain. During the test phase, participants again viewed the + or – sign prior to experiencing the painful stimuli, however, unbeknownst to participants, the same moderately painful stimuli were delivered after every image shown, in order to test conditioning effects. Participants were also shown an ‘o’ symbol on some trials during the test phase that they did not see during the conditioning phase, which could be assumed to be ‘neutral’. After receiving the painful stimulus, participants rated the pain.

Kasey (2).png

During the test phase, functional MRI (fMRI) scanning was performed and the connectivity of the VTA with other brain regions was analyzed while participants viewed the images and anticipated the painful stimuli. The authors studied a ‘positive expectancy effect’, the difference between pain perception in response to the – sign versus the o sign, and a ‘negative expectancy effect’, the difference between pain perception in response to the + sign versus the o sign. Structural MRI data (assessing the brain’s grey matter volume) was also collected.

What did they find?

On average, pain following the -, o and + cues was rated as 2.69/10, 3.32/10 and 4.10/10 respectively during the test phase, indicating that the conditioning phase was effective. The VTA was more tightly functionally connected with the rostral anterior cingulate cortex and the nucleus accumbens during – cues compared to o cues, and less tightly connected during + cues compared to o cues. There was also a negative relationship across trials between perceived pain intensity and VTA connectivity with the aforementioned brain regions. In statistical mediation analyses, VTA – nucleus accumbens functional connectivity and VTA – rostral anterior cingulate cortex functional connectivity were found to mediate the effect of expectancy (due to a cue) on pain perception. For example, if someone had an expectation of high pain and low VTA – nucleus accumbens functional connectivity, this might result in them reporting higher pain perception than they otherwise might have.

When the authors compared VTA functional connectivity across subjects, they found that it did not predict pain responses. However, when they analyzed the structural MRI data, they found that grey matter volumes of the VTA, rostral anterior cingulate cortex, and nucleus accumbens predicted the positive expectancy effect - individuals with larger volumes in these areas were likely to experience a larger effect. Grey matter volume of the rostral anterior cingulate cortex predicted a larger negative expectancy effect.

What's the impact?

This study demonstrates that the function and structure of the VTA and mesocorticolimbic pathways are related to one’s anticipation of a painful experience. These results emphasize the role of the brain’s reward system in shaping how expectancy of pain can alter the way we feel pain.

Hu_quote_Nov12.jpg

Tu et al. Mesocorticolimbic pathways encode cue-based expectancy effects on pain. Journal of Neuroscience (2019). Access the original scientific publication here.

Identity Domains: A Computational Framework for Personality Analysis

Post by Deborah Joye

What's the science?

Personality is the collection of individual behaviors or traits that differ from one human to the next. The ability to organize individual differences in behavior into distinct categories is important for understanding the biological underpinnings of both healthy and pathological behaviors. In humans, many individual differences have been categorized by psychologists into varying personality traits, resulting in the widespread use of personality tests to determine the trait make-up of individuals. However, personality tests tend to rely on self-report questionnaires and do not track actual behaviors as they occur. Like humans, mice also exhibit individual differences in their behaviors. Some mice prefer to stay close to the nest, whereas others leave the nest to explore the environment. Some mice will readily approach a stranger, while others are more reserved. Organizing individual differences amongst other species has been challenging since there are few conceptual frameworks with which to comprehensively categorize behaviors into consistent traits. This week in Nature Neuroscience, Forkosh, Karamihalev, and colleagues present a computational framework that organizes individual behaviors into trait-like dimensions that are stable across development, consistent across social settings, and correlated with gene expression differences within the brain.

How did they do it?

The authors built a semi-naturalistic arena and filled it with different features for mice to interact with such as ramps, feeders, dividing walls, and hiding places. The authors then tracked the behavior of individual mice as they interacted with their cage-mates and environment over several days. They classified both individual behaviors, like movement and foraging and interactions between the mice, like dominance behaviors and other social contacts. The authors then trained their linear discriminant analysis algorithm to look for 60 unique behaviors within the behavioral dataset. Their algorithm was specifically designed to isolate dimensions of the dataset that are the best at discriminating one mouse from another, which they called identity domains. The algorithm does this by maximizing trait variability between each mouse, while also maximizing trait consistency within one mouse. To ensure that their algorithm functioned as planned, the authors validated the analysis on two separate groups of mice and found consistent results. To determine if identity domains were consistent within mice across development, the authors profiled identity domains of juvenile mice, then profiled the same mice as adults. To test whether identity domains remained consistent in different social settings, the authors profiled groups of mice, then mixed the mice up into different groups and profiled them again. Finally, to determine whether identity domains correlated with changing gene expression in the brain, the authors performed RNA sequencing three brain regions (basolateral amygdala, insular cortex, and medial prefrontal cortex) of profiled mice.

What did they find?

The authors’ algorithm captured four identity domains – consistent dimensions of the data that described the stable behavior of individual mice over time. Interestingly, the authors found that when mice were profiled as both juveniles and adults, three of the four assigned identity domains remained stable, suggesting that identity domains capture traits that are consistent across development. The authors then mixed up groups after they had been profiled and found that while mice changed some behaviors in new social settings, their assigned identity domains remained stable. Using RNA sequencing, the authors demonstrated that gene expression variability in 3 different regions could be predicted using identity domain scores, suggesting that behavioral differences captured by identity domains and gene expression in the brain are associated. Finally, the authors investigated the identity domains of mice with known behavioral phenotypes, such as mice that are known to exhibit high anxiety behavior. The authors found that their assigned identity domain scores were highly associated with expected personality traits, suggesting real-world relevance of the identity domain scores.

Deb (6).png

What's the impact?

Individual differences in behavior are quite difficult to study. This work presents a novel framework that offers a more objective study of personality by tracking real behavioral output and categorizing it into trait-like identity domains in mice. Interestingly, identity domains capture differences that are stable over time and in different social contexts. Moreover, the correlation between identity domain scores and gene expression differences in several brain areas suggests that this tool can capture stable behavioral differences that are reflective of fundamental differences in brain function.

Forkosh et al., Identity domains capture individual differences from across the behavioral repertoire, Nature Neuroscience (2019). Access the original scientific publication here.